In this study, the two most recent versions of the ACE-FTS O\(_3\) data, versions 3.6 (v3.6) and 4.1 (v4.1), are examined with the intent to identify and quantify any drift that affects these two data sets. To this end, 17-years of ACE-FTS data, covering 2004 to 2021, are compared to correlative O\(_3\) data sets from other satellite limb-sounding instruments that have been in operation for the entirety of the ACE mission period, namely MAESTRO (Measurement of Aerosol Extinction in the Stratosphere and Troposphere Retrieved by Occultation), Aura MLS (Microwave Limb Sounder), OSIRIS (Optical Spectrograph and Infrared Imaging System), SABER (Sounding of the Atmosphere using Broadband Emission Radiometry), and SMR (Sub-Millimetre Radiometer).
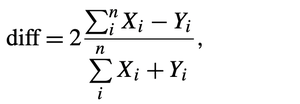
To explore the agreement between these data sets, a set of coincidence criteria were employed such that all profiles for comparison had to have been measured within 6 hours and 300 km of each other. If multiple profiles from a comparison instrument were coincident with an ACE-FTS profile, the profile nearest in latitude to the ACE-FTS profile was used. The relative mean differences were calculated using:

where X\(_i\) are the ACE-FTS values and Y\(_i\) are the values from the instrument being compared. Additionally, the relative precision of the ACE-FTS measurements are evaluated using:

where σ\(_A\) is the standard deviation of the ACE-FTS measurements, σ\(_I\) is the standard deviation of the comparisons measurements, and σ\(_A-_I\) is the standard deviation of the differences. Finally, the drift and its error at each altitude are determined by fitting the 30 day mean relative difference to a linear model, and a Student's t-test is performed to determine the uncertainty in the linear drift at a confidence level of 99%.
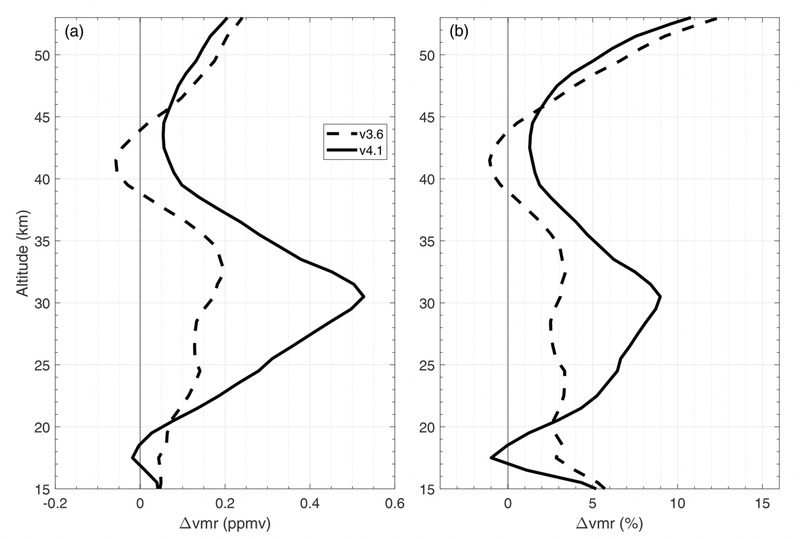
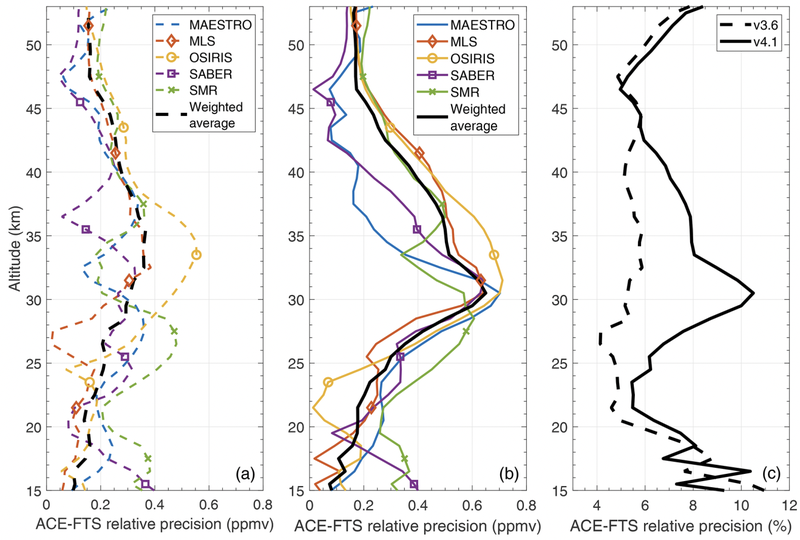
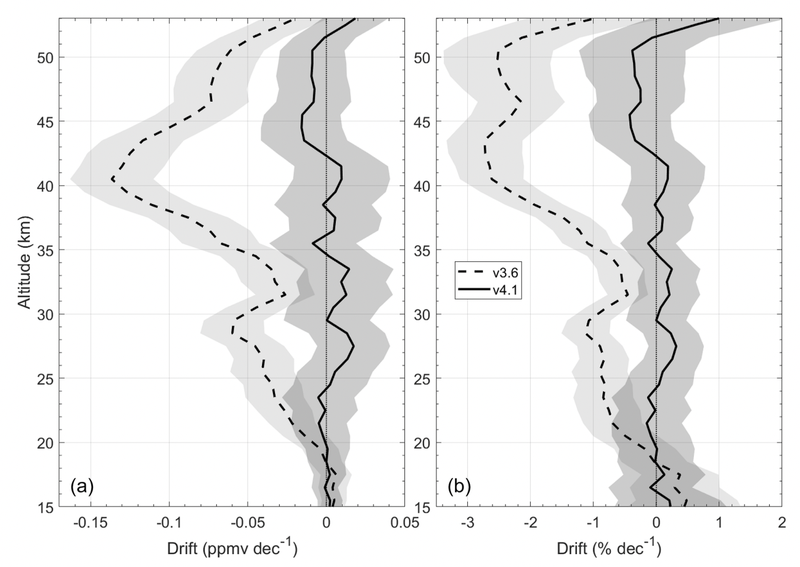
The results of this study are summarized in Figures 1 through 3 below, which show the weighted average of the mean differences (Figure 1), the ACE-FTS relative precision estimates (Figure 2), and weighted average ACE-FTS drift profiles (Figure 3).

Figure 1: Weighted average of the mean differences for comparisons between ACE-FTS and all instruments given in volume mixing ratio units (a), and as a percent difference (b). The dashed lines correspond to ACE-FTS v3.6 and solid lines to v4.1.

Figure 2: The relative precision estimates of ACE-FTS relative to each instrument for v3.6 (a) and v4.1 (b), as well as for comparisons against a multi-instrument mean (c). The former two are in volume mixing ratio units, while the latter is expressed as a percentage.

Figure 3: Weighted average ACE-FTS drift profiles, expressed in volume mixing ratio units per decade (a) and as a percent change per decade (b), for v3.6 (dashed lines) and v4.1 (solid lines). The shaded regions represent the 99% confidence bounds.
Reference
Sheese, P. E., Walker, K. A., Boone, C. D., Bourassa, A. E., Degenstein, D. A., Froidevaux, L., McElroy, C. T., Murtagh, D., Russell III, J. M., and Zou, J.: Assessment of the quality of ACE-FTS stratospheric ozone data, Atmos. Meas. Tech., 15, 1233–1249, https://doi.org/10.5194/amt-15-1233-2022, 2022.
