In this study, water vapour isotopologues (H2O and HDO) measured in three datasets (MIPAS-ESA v8, MIPAS-IMK v5, and ACE-FTS v4.1/4.2) are compared to assess the degree of agreement observed across the datasets. This is done as variations in isotopologic composition of water vapour aid in our understanding of the role of different mechanisms of water vapour transport between the tropical upper troposphere and the lower stratosphere. These three datasets are compared on a profile-to-profile basis, with coincidence criteria requiring a spatial separation of less than 1000 km, a temporal separation of less than 24 h and a geolocation separation of less than 5° between MIPAS-ESA/MIPAS-IMK and ACE-FTS, and with a temporal separation of 2 s and a geolocation separation of less than 1° between MIPAS-ESA and MIPAS-IMK. In addition to comparing the gas products, the isotopic ratio δD is also analyzed. This value is calculated using:
where R is determined through the concentration of the isotopologues of water as:
and RVSMOW is the Vienna Standard Mean Ocean Water reference ratio. The average vertical profiles of H2O, HDO, and δD are shown in Figure 1 for coincident measurements from the the three datasets. Generally good agreement is found between 16 and 30 km for H2O, with near zero biases found between MIPAS-ESA and ACE-FTS in this range. Low biases are found in the MIPAS-ESA and ACE-FTS comparisons of HDO and δD over the same range.
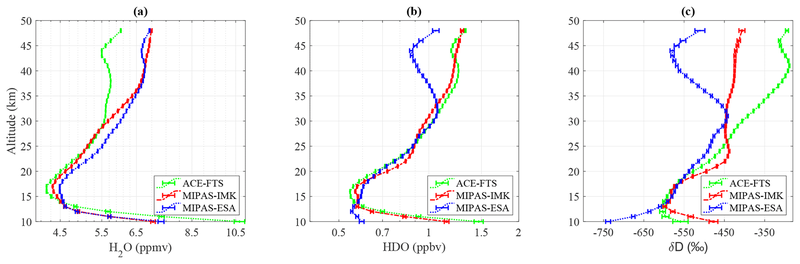
Figure 1: Mean vertical profiles for H2O (a; left panel), HDO (b; middle), and δD (c; right panel) from ACE-FTS (green), MIPAS-IMK (red), and MIPAS-ESA (blue). Bars represent standard error of the mean.
Temporal signals in these three datasets are also assessed, with particular focus placed on analyzing these time-varying signals for H2O, HDO, and δD in the equatorial region (30° N to 30° S). As shown in Figure 2, the tropical tape recorded signature is evident in all three datasets, but some differences are evident, including a greater degree of noise in the ACE-FTS dataset, a stronger tape recorded amplitude in the two MIPAS datasets, and an annual variation that extends further into the stratosphere in the MIPAS-IMK dataset than the MIPAS-ESA dataset. Similar signatures are noted in the HDO dataset. However, significant difference is found for the δD plots. Here, the tape recorded signal is present but significantly weaker for MIPAS-ESA and ACE-FTS than for MIPAS-IMK. Thus, to rectify the observed differences, and the differences in interpretation that they may contribute to, further improvements in the datasets are needed to better understand and reduce differences in the distributions and annual variation of δD.
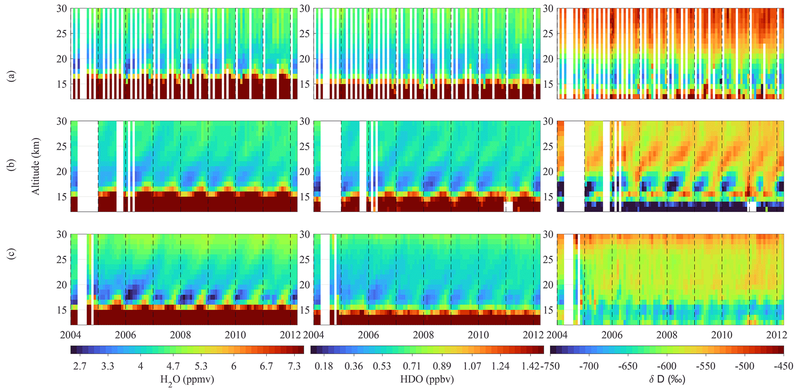
Figure 2: Altitude vs time diagrams of H2O (left column), HDO (middle column), and δD (right column) averaged over the equatorial region (30° N to 30° S) from ACE-FTS (top row), MIPAS-IMK (middle row) and MIPAS-ESA (bottom row).