Geophysical variability in atmospheric measurements describes the uncertainties due to sampling at different times and locations. One of the ways that reduces this variability is to use chemical models to track air parcels either in a forward or backward trajectory however, this method is computationally expensive.
This study uses readily available climate model outputs of CMAM (Canadian Middle Atmosphere Model), EMAC (ECHAM/MESSy Atmospheric Chemistry), and WACCM (Whole Atmosphere Community Climate Model) to estimate large scale geophysical variability in the ACE-FTS (Atmospheric Chemistry Experiment – Fourier Transform Spectrometer) and OSIRIS (Optical Spectrograph and InfraRed Imaging System) ozone products.

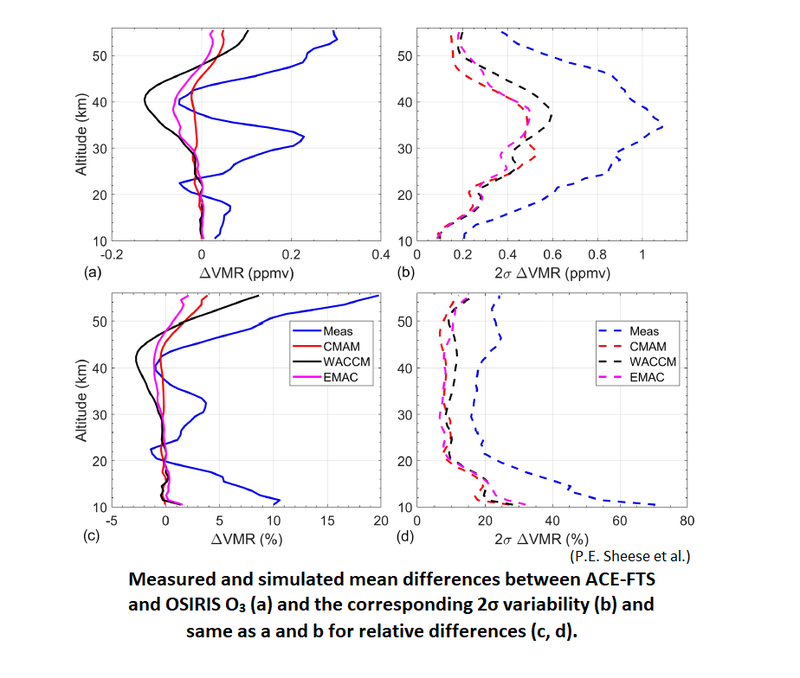
The model \(O_3\) data was sampled at the instrument time and geolocation by the use of linear and bilinear interpolation between the different grids respectively. The model (MOD) datasets were used to estimate the geophysical variability at each altitude, which, is defined to be the \(2\sigma\) standard deviation of the differences between the simulated ACE-FTS and OSIRIS values (Equation 1). The relative differences are also calculated via equation 2 where the differences between ACE-FTS and OSIRIS are divided by the overall mean of the model values. In equation 2, \(N\) is the number of coincident values at that altitude.
The figure below shows the geophysical variability profiles for coincidence criteria of within 6 hours and 500 km. All three models agree well with each other with the \(2\sigma\) variation increasing to 0.6 ppmv near 30-40 km and decreasing to 0.2 ppmv at 55 km altitude.

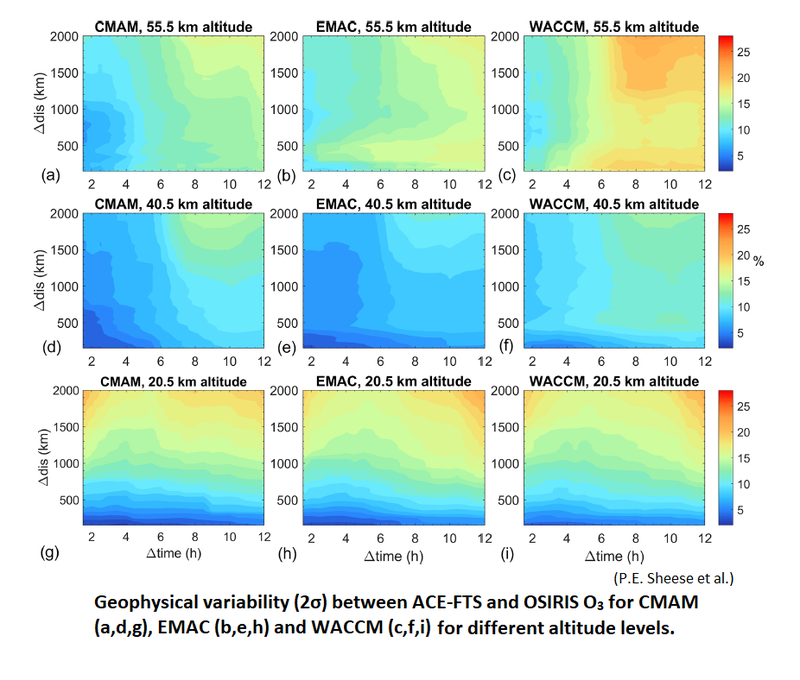
The geophysical variability for all three models was determined for all time differences between 1.5 to 12 hours in 0.5 hour increments and for distance differences of 150 km to 2000 km in 50 km increments shown for three altitude levels in the figure below. All three models show similar variability patterns for the different coincidence criteria.

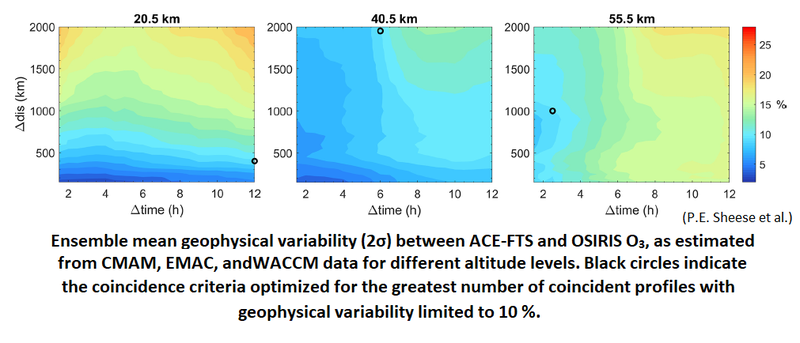
The mean of all three model results was taken to give ensemble mean values of the geophysical variability shown below. The left panel shows that the geophysical variability at low altitudes is relatively independent of the time difference criterion and the right panel shows that the geophysical variability at high altitudes is relatively independent of the distance difference criterion. At mid latitudes (middle panel) the geophysical variability is dependent on both the time and distance difference criterion.

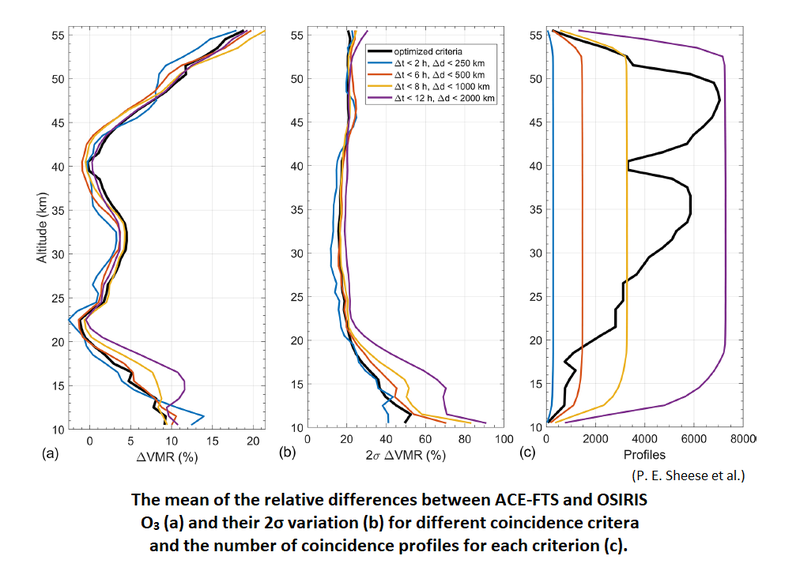
It is possible to optimize the coincidence criteria at each altitude level for 10% of \(2\sigma\) variability but the drawback is that it can produce biases between altitudes due to changing seasonal and latitudinal sampling. This optimization can reduce the geophysical variability and increase the number of coincident profiles for comparisons. Five different coincidence criteria was used to optimize the maximum geophysical variability to 10% above 17 km and to 15% below 17 km and comparisons were made shown in the figure below. Panel (a) shows that at most altitudes the bias between the two instruments is independent of the coincidence criterion. However, in panel (b) the \(2\sigma\) standard deviations of the relative differences shows more dependence on the coincidence criteria. Panel (c) shows that the number of coincidence profiles in the 2 hour and 250 km criterion is quite low. The higher the number of profiles the more robust and consistent results are acquired. This would be more useful when looking at specific regions rather than on a global scale.

Reference
Sheese, P. E., Walker, K. A., Boone, C. D., Degenstein, D. A., Kolonjari, F., Plummer, D., Kinnison, D. E., Jöckel, P., and von Clarmann, T.: Model estimations of geophysical variability between satellite measurements of ozone profiles, Atmos. Meas. Tech., 14, 1425–1438, https://doi.org/10.5194/amt-14-1425-2021, 2021.
