In this study, CO measurement products from the TROPOspheric Monitoring Instrument (TROPOMI), Atmospheric Chemistry Experiment - Fourier transform spectrometer (ACE-FTS), and a ground-based Fourier transform spectrometer located at the Polar Environment Atmospheric Research Laboratory (PEARL; PEARL-FTS) in Eureka, Nunavut (80.05° N, 86.42° W) are inter-compared to characterize their validity and accuracy. Comparisons were made using both unsmoothed and smoothed profiles, with the latter generated using the averaging kernel of the lower vertical resolution instrument for each set of instrument comparisons.
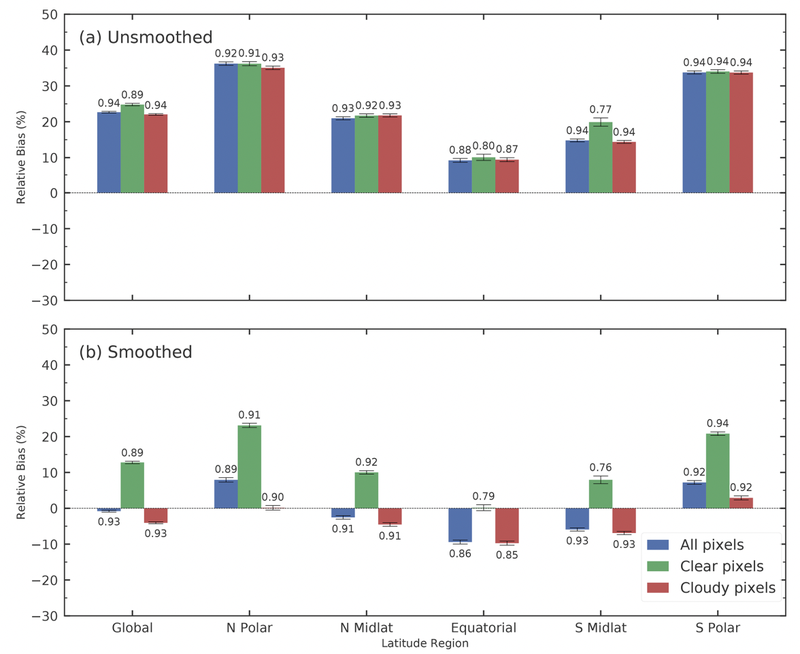
A global comparisons of CO partial columns from ACE-FTS and TROPOMI was performed using colocated measurements made between 28 November 2017 to 31 May 2020. Excellent agreement was noted between these two CO products, with a Pearson correlation coefficient of R=0.93 and a mean relative bias of -0.79 ± 0.26 % globally. Further investigation into the agreement between the two products over five latitude bands, covering the north polar region (60-90° N), the northern mid-latitudes (20-60° N), the equatorial region (20° S-20° N), the southern mid-latitudes (20-60° S), and the south polar region (60-90° S) showed more varied responses. Specifically, a latitudinal dependence on the mean differences was observed, with positive mean relative biases of 7.93±0.61% in the north polar region and 7.21±0.52% in the south polar region. A negative bias of −9.41 ± 0.55% was found in the equatorial region. Despite the variability in the magnitude and direction of the mean biases, strong correlations were found, ranging from R = 0.93 in the southern midlatitudes to R = 0.86 in the equatorial region. These differences are summarized in Figure 1 below.
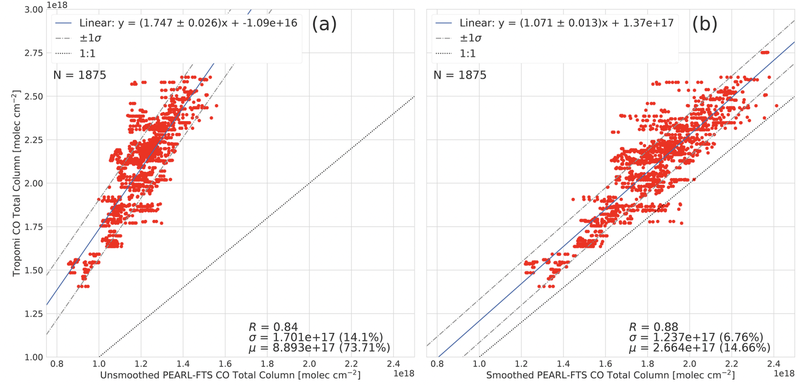
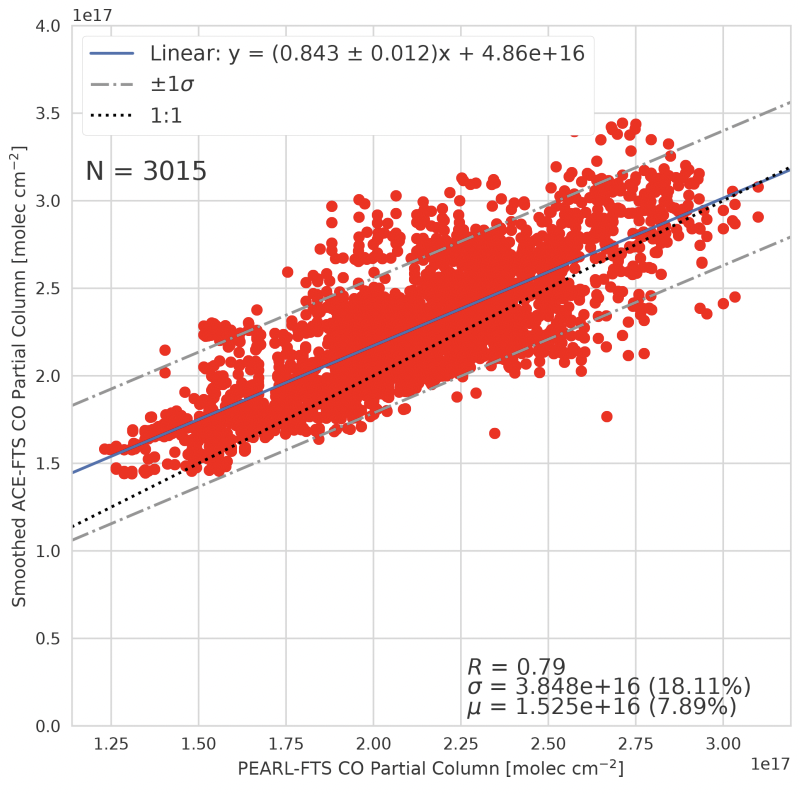
Good agreement was also noted in the comparisons between TROPOMI and PEARL-FTS CO total columns, and between ACE-FTS and PEARL-FTS CO partial columns. The former comparisons involved measurements made between 3 March 2018 and 27 March 2020 and found a strong correlation, R=0.88, and a systematic mean positive bias of 14.7 ± 0.16%, while the latter involved measurements made between 25 February 2007 to 18 March 2020, and found good agreement, R=0.79, and a mean positive bias of 7.89±0.21% in ACE-FTS with respect to the groundbased FTS. Correlation plots of the TROPOMI and PEARL-FTS CO total columns are shown in Figure 2, for both smoothed and unsmoothed comparisons, while Figure 3 shows the correlation plot between ACE-FTS and PEARL-FTS partial columns in the range of 9.33 to 66.58 km.
Overall, the magnitude and sign of the average relative differences are consistent between the sets of comparisons presented in this work, and with prior studies that have examined these instruments. The TROPOMI CO product exhibits a high bias in the high-Arctic region, but as the observed mean differences lie within its mission accuracy requirement of ±15%, the data quality of the TROPOMI CO product meets the required specifications.

Figure 1. Summary of the relative differences between TROPOMI and ACE-FTS for the unsmoothed (a) and smoothed comparisons (b). Comparisons are shown for all TROPOMI pixels, for cloud-free pixels, and for cloud-covered pixels. The error bars correspond to the standard errors of the mean, and the values above and below the error bars are the Pearson correlation coefficients for that particular case and latitude region.

Figure 2. Correlation plots of TROPOMI CO total columns with unsmoothed (a) and smoothed (b) PEARL-FTS CO columns for the period 3 March 2018 to 27 March 2020.

Figure 3. Correlation plot for ACE-FTS vs. PEARL-FTS CO partial columns for the period from 25 February 2007 to 18 March 2020.
