This study presents recent work on the development of scaling factors designed to account for the diurnal variability of ozone (O\(_3\)) and nitrogen dioxide (NO\(_2\)) when comparing observations from the Stratospheric Aerosol and Gas Experiment (SAGE) III/ISS instrument to observations from other instruments, made at different times of the day. Both O\(_3\) and NO\(_2\) experience diurnal cycles due to photochemistry, with a particularly large cycle, accounting for a three-fold difference between the minimum and maximum, in the latter species. This effect greatly hinders comparison and validation efforts for these two species, obscuring measurement biases with temporal differences. Accounting for this diurnal cycle allows a greater number of observations to be directly compared, as the observations can occur at different times without unduly affecting the trace gas concentrations compared.
The diurnal scaling factors developed as a part of this study are calculated from model simulations of the distribution and variability of O\(_3\), NO\(_2\), and other trace gases and aerosols. The model used for this is the global three-dimensional Goddard Earth Observing System (GEOS) model, which has been coupled with the Global Modeling Initiative (GMI) stratospheric and tropospheric chemistry mechanism and the Goddard Chemistry Aerosol Radiation and Transport (GOCART) aerosol module. The production of the scaling factors begins with determining the ratio of O\(_3\) and NO\(_2\) concentrations at each solar zenith angle to their concentrations at sunrise and sunset. Monthly-means of these values are then used to construct the scaling factors for each latitude, altitude, and SZA; with monthly-mean and zonal-mean values used for this to filter out the influence of dynamics on the diurnal variability of O\(_3\). Scaling factors are determined for each month between 2017 and 2020, as well as climatological averages of each month calculated from this period.
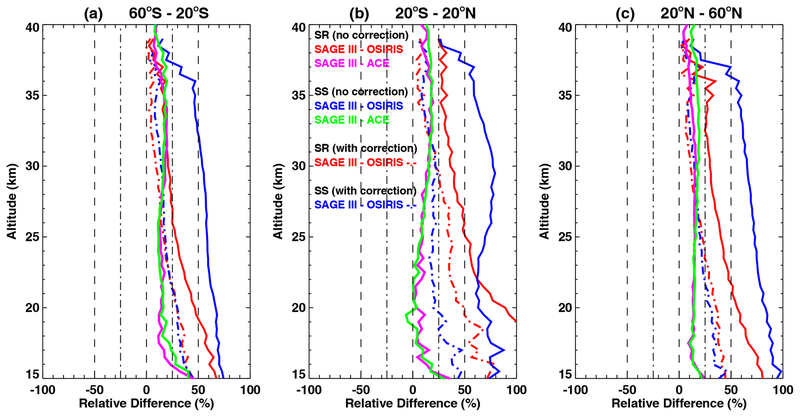
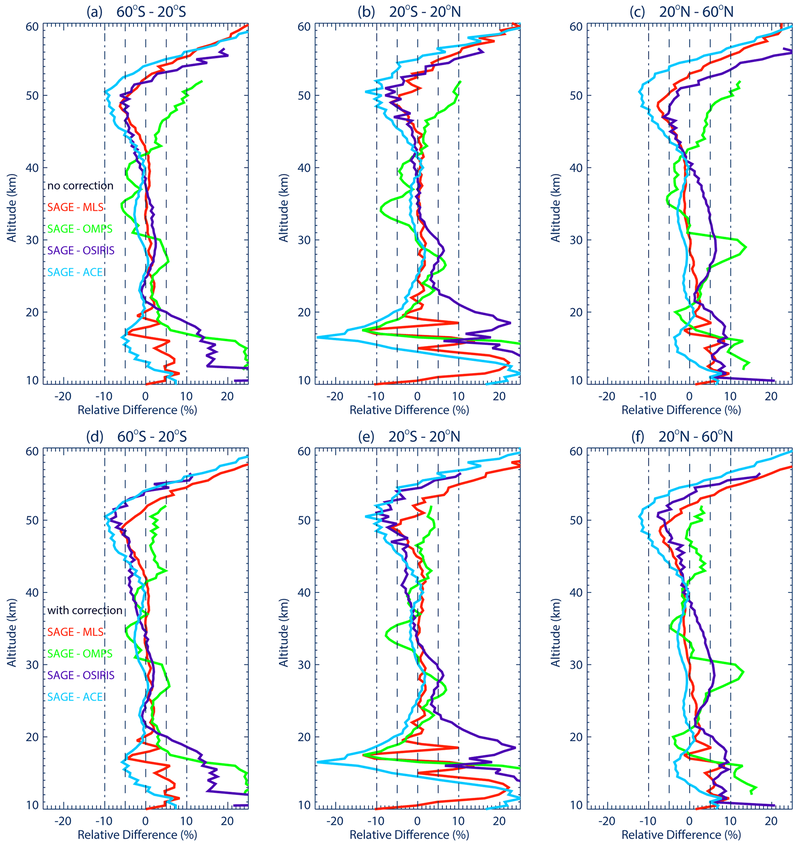
In order to compare SAGE III/ISS measurements with those of other instruments, coincidence criteria are employed; specifically, same-day measurements are required to be made within 3 degrees latitude and 10 degrees longitude to be considered coincident. For SAGE III/ISS measurements to be considered coincident with ACE-FTS a stricter time criteria is employed, necessitating that the measurements are made within 3 hours of each other, and matching sunrise and sunset measurements between the two instruments. The results of the intercomparisons between SAGE III/ISS and ACE-FTS and Odin-OSIRIS NO\(_2\) are shown in Figure 1, while comparisons between SAGE III/ISS and MLS, OMPS, Odin-OSIRIS, and ACE-FTS O\(_3\) are shown in Figure 2. Due to the coincidence criteria for ACE-FTS necessitating the matching of sunrise and sunset measurements, no diurnal scaling factor was applied to comparisons between SAGE III/ISS and ACE-FTS NO\(_2\).

Figure 1: Average relative difference between SAGE III/ISS sunrise (SR) and sunset (SS) and ACE-FTS and Odin-OSIRIS NO\(_2\) observations over three latitude bands. Odin-OSIRIS comparisons are shown with and without the application of diurnal corrections in dashed and solid lines respectively.

Figure 2: Average relative difference between SAGE III/ISS and MLS, OMPS, Odin-OSIRIS, and ACE-FTS O\(_3\) over three latitude bands. The top row is presented without the application of diurnal corrections, while the bottom row is shown with their usage.
Overall, it was found that the application of diurnal scaling factors improves the comparison between SAGE III/ISS and OSIRIS NO\(_2\) and between SAGE III/ISS and OMPS, MLS, Odin-OSIRIS, and ACE-FTS O\(_3\) observations. For NO\(_2\), the disagreement between SAGE III and ACE-FTS for both sunrise and sunset measurements is generally 20 % or less for most altitudes, and generally within 10 % between 20 and 50 km for most comparison sets when corrected for diurnal variability. For O\(_3\), the difference between SAGE and coincident measurements is mostly within 5 % between 20 and 40 km, with ACE-FTS showing a larger bias above 45 km and below 25 km, largely in agreement with the other comparison instruments.
