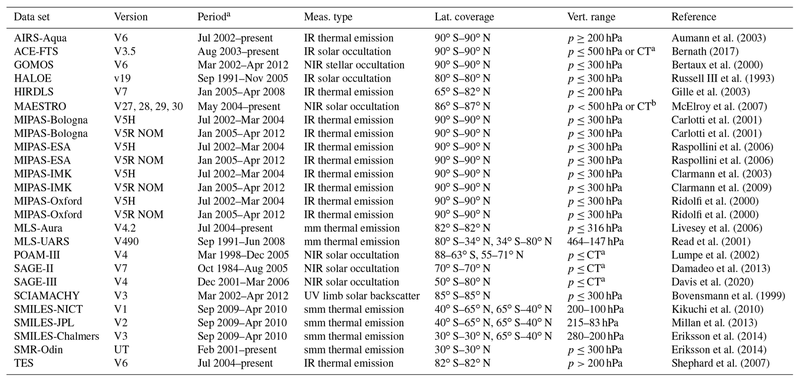
In this study, measurements of upper tropospheric (300–100 hPa) humidity from nineteen limb-viewing data sets and two nadir viewing data sets are compared, both against each other and to frost-point hygrometer balloon sondes. Included in this is the ACE-FTS version 3.5 dataset, with data considered from 2004 to 2022. This study focuses on the upper troposphere due to the measurement challenges posed by the region, including the highly variable concentration of water vapour, sharp changes in the vertical gradients of gas concentration near the tropopause, the presence of clouds, and highly variable atmospheric temperatures. The satellite data sets used in this study are shown in Figure 1 below.

Figure 1: Satellite data sets used in this study, including their version, period of measurement, type of measurement, latitudinal coverage, and vertical coverage.
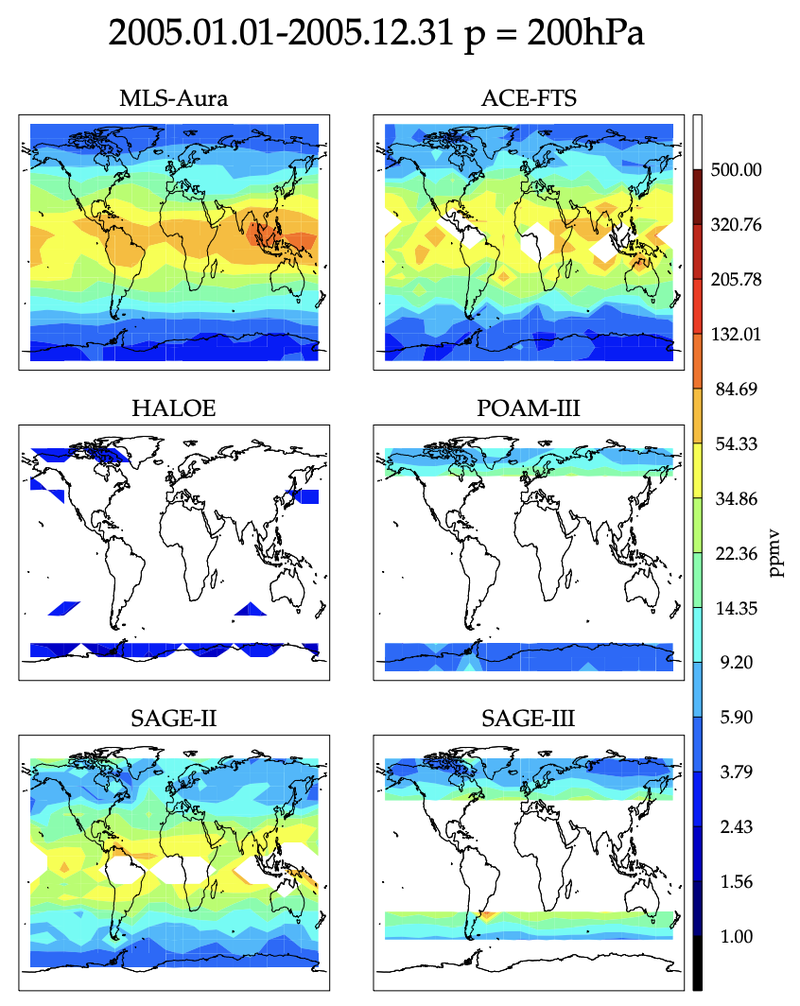
Assessment of satellite-measured upper tropospheric humidity is based on coincident comparisons with balloon frost-point hygrometer sondes, multi-month mapped comparisons, zonal mean time series comparisons, and coincident satellite-to-satellite comparisons. The satellite data sets yielded qualitatively similar features in their maps and time series of humidity, but quantitatively these fields varied by up to a factor of 2, with a large dependency on this bias on the amount of water vapour. An example of the gridded maps generated for water vapour at various pressure levels from the different datasets is shown in Figure 2.

Figure 2: Gridded maps for occultation humidity retrieval products at 200 hPa, averaged over 2005.
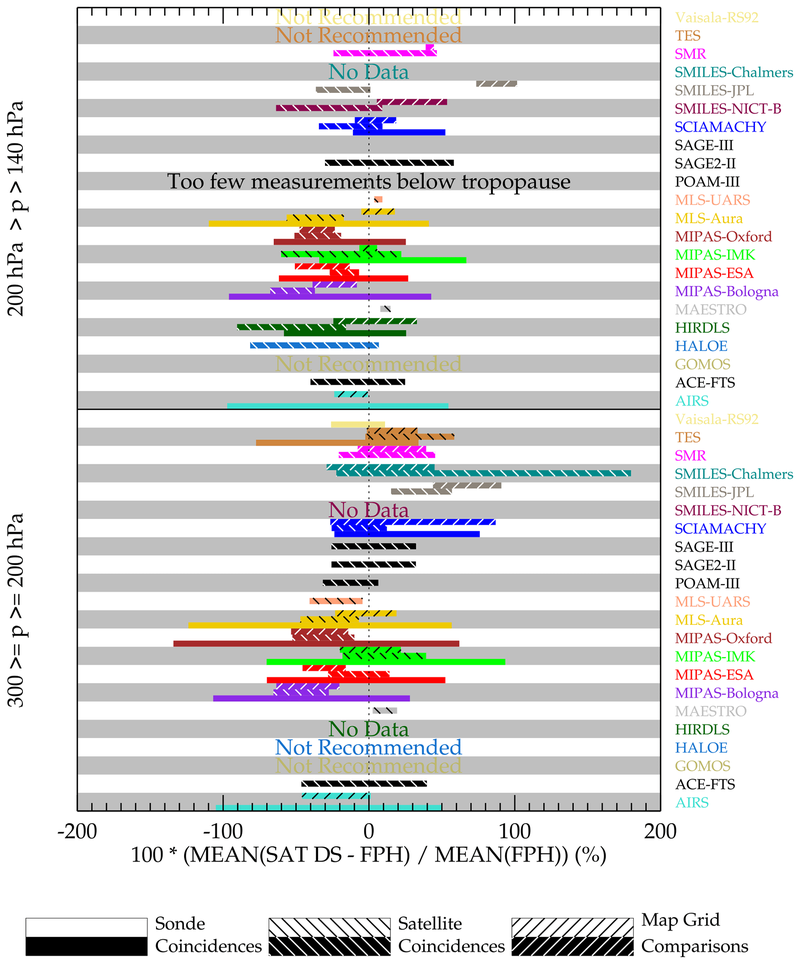
Overall, this study found that most of the satellite data sets reviewed show on average ∼30 % agreement amongst themselves and frost-point data but with an additional ∼30 % variability about the mean bias. The biases of these instruments are summarized in Figure 3. It was found that occultation sounders can provide accurate profile measurements, and ACE-FTS performed the best among the data sets based on the range of concentration values it could sample, its long operational period, and the accuracy of its measurements. However, these instruments suffer from sparse sampling, which, coupled to the high temporal and spatial variability of water vapour in the upper troposphere, can limit their usefulness.

Figure 3: Summary plot of biases among the satellites (SAT DS) and Vaisala RS92 sensor for the upper troposphere relative to balloon frost-point hygrometer (FPH) measurements (zero value on the x axis). The sonde coincidences have no hatching and are shown in the bottom third of the y axis band dedicated to the data set. The satellite coincidences and mapped grid comparisons have either black or white diagonal hatching, depending on the darkness of the data sets colour and are shown in the middle and top third of the y axis dedicated to the data set.
