This study presents zonal-mean multiyear-mean climatologies of upper troposphere–lower stratosphere (UTLS) water vapour and ozone, generated from 14 years of measurements made by three Canadian limb-viewing satellite instruments. The three instruments are the Atmospheric Chemistry Experiment Fourier Transform Spectrometer (ACE-FTS), the Measurement of Aerosol Extinction in the Stratosphere and Troposphere Retrieved by Occultation (MAESTRO), and the Optical Spectrograph and InfraRed Imaging System (OSIRIS; ozone only). The intention of this selection of these limb-viewing instruments is to explore their capability for representing the UTLS, while enabling analysis of the impact of different measurement sampling patterns.
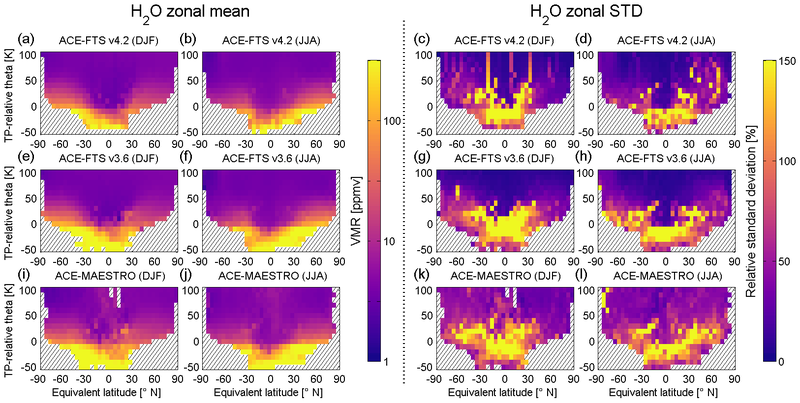
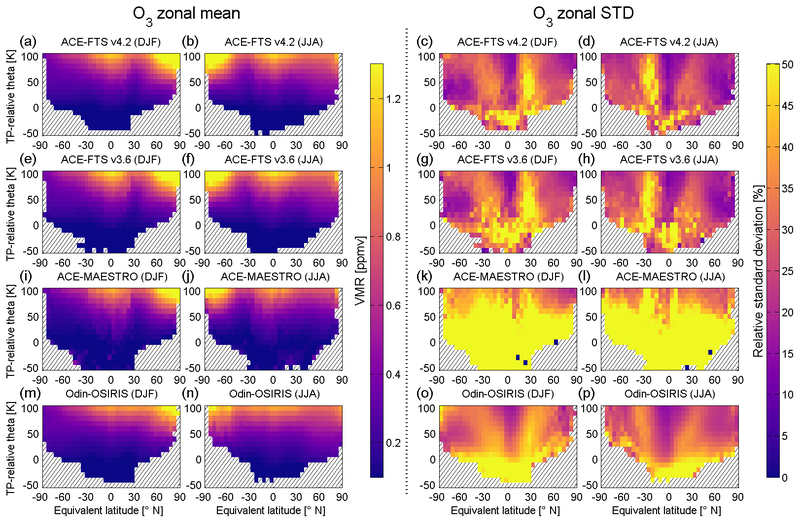
In an effort to best represent the distribution of these two gases in the UTLS, which is characterized by a high degree of dynamic and geophysical variability, the climatologies constructed in this work make use of tropopause-relative potential temperature and equivalent-latitude coordinates. Prior work has shown that this selection of coordinates is capable of minimizing the impact of geophysical variability on the distributions of trace gases in the UTLS. The climatologies constructed here use 5 degree equivalent latitude and 10 K potential temperature spacing, and are provided on a monthly, seasonal (3-month), and yearly basis. Two 3-month periods, December–January–February (DJF) and June–July–August (JJA), are examined in detail, the climatologies for which are presented in Figures 1 and 2.

Figure 1: Zonal-mean multiyear-mean water vapour climatologies constructed from the ACE-FTS version 4.2 (a–b), ACE-FTS version 3.6 (e–f), and MAESTRO (i–j) datasets for DJF (a, e, i) and JJA (b, f, j) in tropopause-relative potential temperature and equivalent-latitude coordinates. Also shown is the relative standard deviation for DJF (c, g, k) and JJA (d, h, l).

Figure 2: Same as Figure 1 but for ozone and including an additional row (m–p) for climatologies constructed from the OSIRIS dataset.
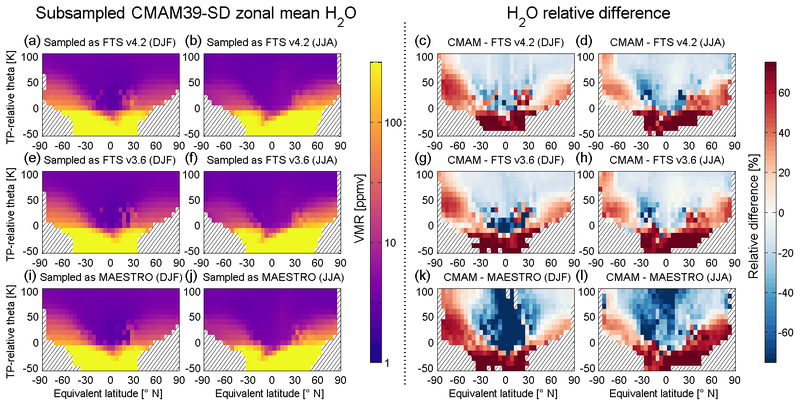
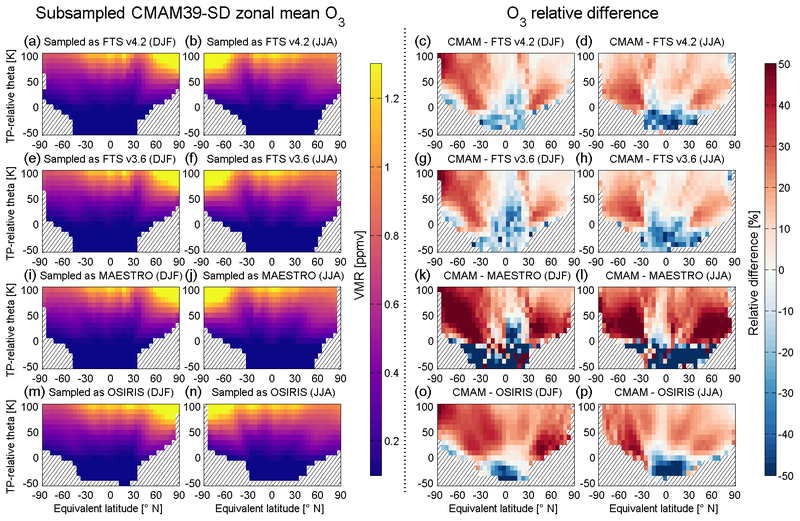
In order to assess the agreement of the climatologies between the different datasets, they are compared to reference climatologies constructed from the Canadian Middle Atmosphere Model 39-year specified dynamics (CMAM39-SD) run, subsampled to the times and locations of the satellite measurements. This method used a subsampled model to quantify the impact of each instrument's measuring pattern and determine its influence on the multiyear-mean climatologies in a robust fashion. This facilitated a consistent evaluation of the distributions of these two gas species. Figures 3 and 4 show the model subsampled climatologies and the comparisons of these against the instrument climatologies.

Figure 3: Comparisons between the climatologies generated from the CMAM39-SD model subsampled to the times and locations of the ACE-FTS version 4.2 (a–d), ACE-FTS version 3.6 (e–h), and MAESTRO (i–l) measurements and the satellite datasets. The zonal-mean multiyear-mean subsampled climatologies used for the comparisons are shown in the first (DJF) and second(JJA) columns, with the label in each plot giving the instrument measurement pattern the model is sampled with. Water vapour relative differences (%) between measurement climatologies and the CMAM39-SD reference climatologies are shown in the third (DJF) and fourth (JJA) columns.

Figure 4: Same as Figure 3 but for ozone and including an additional row (m–p) for climatologies constructed from the OSIRIS dataset.
The findings from this comparison indicated that the two versions of ACE-FTS agreed to within 8% for water vapour and 2% for ozone, while MAESTRO differed by 15%–41 % from ACE-FTS for water vapour and 30 %–35 % for ozone. OSIRIS was found to agree with ACE-FTS to within 10% for ozone, and with MAESTRO to within 25%. Overall, it was found that the set of Canadian limb sounders yielded generally similar water vapour and ozone distributions in the UTLS, with some exceptions for MAESTRO depending on the season and gas species.
