This study analyzes measurements of chlorodifluoromethane (CHClF2, HCFC-22), an anthropogenically released trace gas that acts in the atmosphere as both an ozone depleting substance and as a greenhouse gas, from ACE-FTS. Originally hydrochlorofluorocarbons (HCFCs) were introduced as replacements for the ozone-depleting chlorofluorocarbons (CFCs) that were banned by the 1987 Montreal Protocol, and while subsequent amendments aimed to restrict their usage, HCFCs have seen widespread usage since the 1990's, resulting in large increases in their atmospheric concentrations since this time. HCFC-22 is the most abundant of these HCFCs in the atmosphere. While originally HCFCs were chosen as replacements for CFCs due to their reaction with OH in the troposphere, representing a sink for these species that reduces their ability to reach the stratosphere, the long tropospheric lifetime of HCFC-22 (approximately 13 years) is more than sufficient to allow significant amounts of HCFC-22 to reach the stratosphere. In the stratosphere, the loss processes for HCFC-22 are slower, leading to a much longer stratospheric lifetime (approximately 120 years). Between 1995 and 2020, surface concentrations of HCFC-22 rose from 110 ppt to 248 ppt, a concerning increase given its strong radiative forcing effect of 0.208 W m-2 ppbv-1, and its contribution of ozone-depleting chlorine to the stratosphere.
Currently, ACE-FTS is the only instrument that provides vertically resolved profiles of HCFC-22 from space. Coupled to the global coverage and the longevity of the ACE mission, this measurement product represents an essential tool for examining the evolution of HCFC-22 in the atmosphere since 2004. This study aims to assess the ACE-FTS HCFC-22 v5.2 product in the upper troposphere and lower stratosphere (5.5 to 24.5 km) as well as simulations of HCFC-22 from a 39-year specified dynamics run of the Canadian Middle Atmosphere Model (CMAM39). The ACE-FTS measurements and CMAM39 simulations are compared against measurements made by the Michelson Interferometer for Passive Atmospheric Sounding (MIPAS) instrument on Envisat, a cryogenic whole-air sampler (BONBON) flown on three balloon flights, the Jet Propulsion Laboratory (JPL) Mark IV (MkIV) interferometer flown on ten balloon flights, six years of data from the Civil Aircraft for the Regular Investigation of the atmosphere Based on an Instrument Container (CARIBIC) aircraft mission, and weekly data collected at 12 NOAA Global Monitoring Laboratory sites. To calculate relative differences between datasets, all comparisons made with ACE-FTS use ACE-FTS as the reference, and all comparisons made with CMAM39, except for those made with ACE-FTS, use CMAM39 as the reference. This results in the following relative difference formula for ACE-FTS:
and similarly for CMAM39:
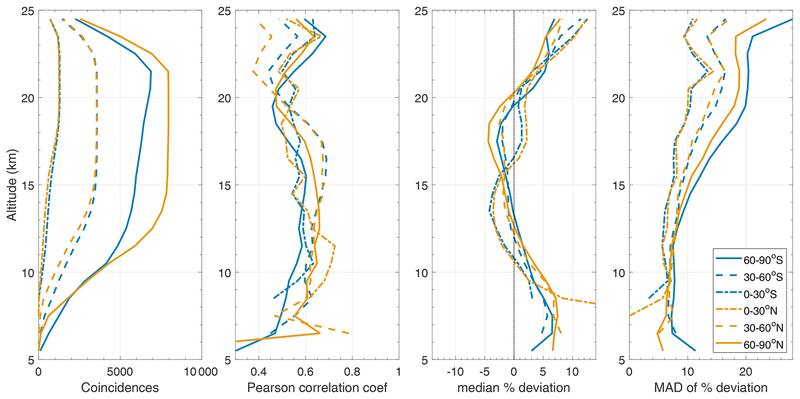
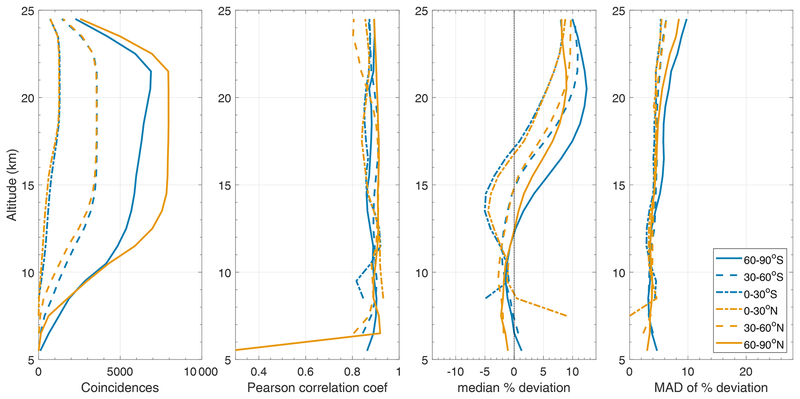
In addition to the relative difference, the correlation between datasets is also considered. The results for the comparisons between ACE-FTS and MIPAS are shown in Figure 1, and Figure 2 shows the the comparisons between CMAM39 and MIPAS. For the former, coincidence criteria of 12 hours, 10 degrees latitude and 20 degrees longitude are used, while for the latter, the times and locations of the MIPAS data coincident with ACE-FTS are used to subsample the CMAM39 model output to allow for comparisons. When comparing against correlative satellite, aircraft, and balloon data, ACE-FTS typically exhibits a low bias on the order of 0-10 % between 5 and 15 km and is typically within 15 % between 15 and 25 km.

Figure 1: Results for ACE-FTS and MIPAS HCFC-22 comparisons. Shown are the number of coincident profiles (left), the correlation coefficients (second from the left), median of percent deviations relative to ACE-FTS (second from the right), and MAD of percent deviations (right).

Figure 2: Same as Figure 1 but for comparisons between CMAM39 and MIPAS.
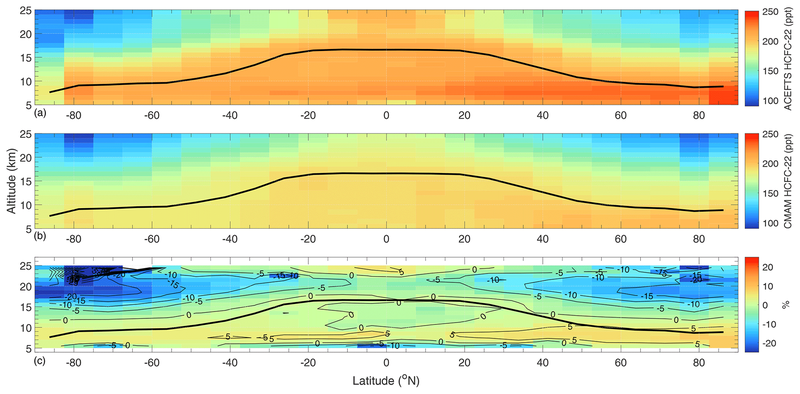
ACE-FTS and CMAM39 are also direcrly compared by subsampling the latter to the times and locations of measurements in the former. Climatologies constructed from these datasets are shown in Figure 3, alongside the relative difference calculated from such. Overall, it was found that ACE-FTS HCFC-22 generally agrees with subsampled CMAM39 data to within ±5 %, except between 15 and 25 km in the extratropical regions where ACE-FTS possesses a negative bias of 5-30 %, and near 6 km in the tropics where ACE-FTS possesses a negative bias of 15 %.

Figure 3: Zonally averaged latitude–altitude distributions of HCFC-22; ACE-FTS (top), subsampled CMAM39 (middle), and the relative difference between the two. The black line represents the location of the thermal tropopause.
