In this study, two decades of ozone measurements from ACE-FTS are compared against ozonesonde data from across the globe. Two methods are used by which the data are compared; the first being through simple coincident-pair measurement comparisons, and the second through comparison of monthly mean time series. For the latter, the time series generated from ACE-FTS are done so in a ±5° latitude, ±30° longitude box around the various stations whose ozonesonde launches are assessed. The ozonesonde stations used in this study are shown in Figure 1.
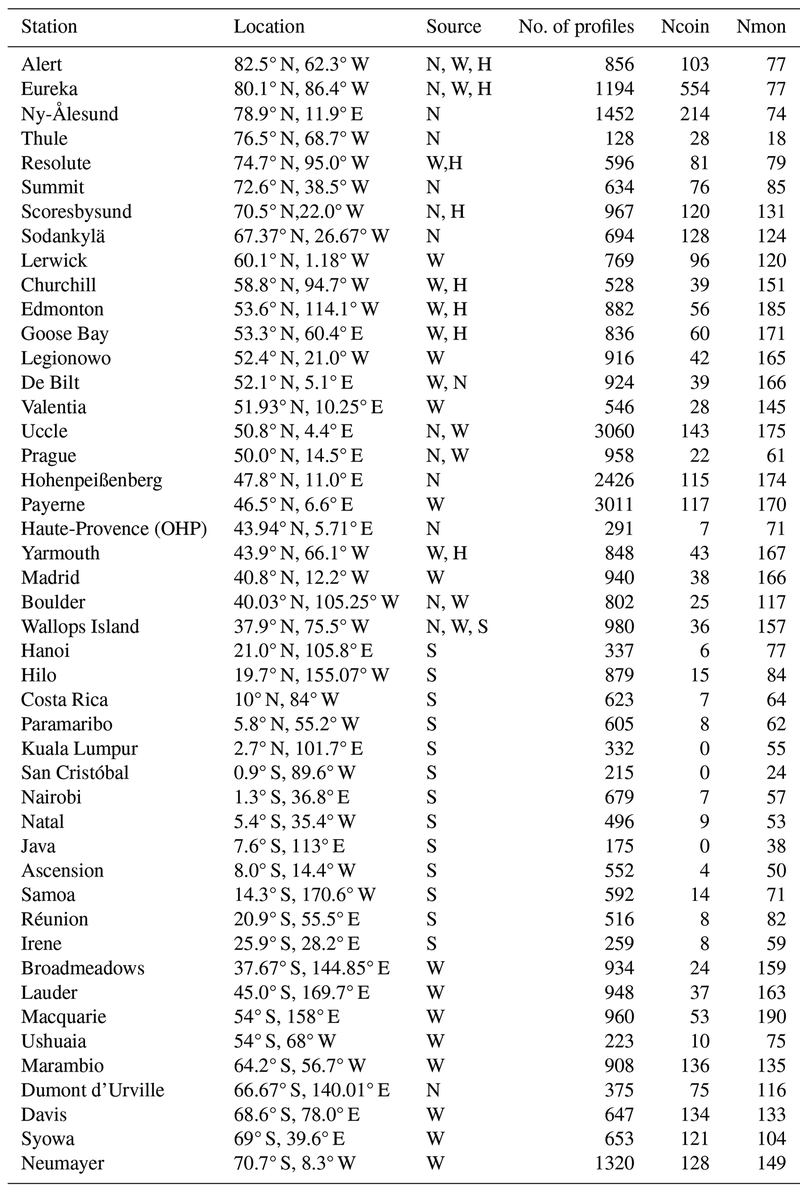
Figure 1: Ozonesonde stations used in this study, belonging to the NDACC (N), WOUDC (W), SHADOZ (S), and HEGIFTOM (H) networks. Alongside the station and the networks it belongs in are the number of ozonesonde profiles for the station, the number of coincident measurements with ACE-FTS, and the number of months for which monthly-mean time series can be constructed.
The aggregated mean relative difference between ACE-FTS and the ozonesonde profiles is shown in Figure 2. From these plots, it can be seen that the ACE-FTS ozone profiles generally exhibit high biases in the stratosphere above ∼ 20 km that increase with altitude up to approximately 10 % around 30 km. Between the tropopause and 20 km, biases of up to ± 10 % are found, depending on altitude and latitude, with the largest biases found in the tropics and southern mid-latitudes.
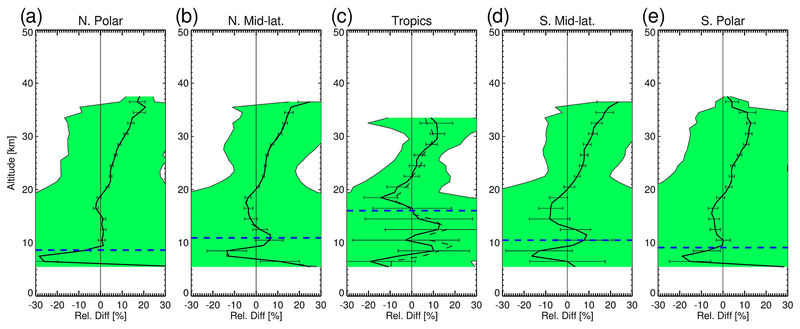
Figure 2: Mean aggregated relative difference between ACE-FTS and coincident ozonesonde profiles in five latitude bands. The shaded areas represent the 2 standard deviation range for the aggregated data points and the horizontal bars represent the 2 standard deviation range for the standard error of the aggregated means.
Similar results are found with the monthly-mean time series analysis to the above set of profile comparisons, but the monthly-mean time series also allow for estimates of the drift between ACE-FTS and the ozonesonde datasets. Here, it is found that overall there is no significant drift in the ACE-FTS ozone data record, with high variation observed between different stations. When averaged over latitude bands, there are small, non-significant drifts of 1-2 % per decade in the northern midlatitudes and polar regions, as well as in the southern polar region. A < 5 % per decade drift is found in the tropics and southern midlatitudes, but this drift is also not significant as its standard deviation is equal to the magnitude of the drift. Thus, the ACE-FTS ozone data record is found to be generally stable over the lifetime of the instrument.