This study presents the first retrievals of the hydrofluorocarbon (HFC) 1,1,1,2-Tetrafluoroethane or CH\(_2\)FCF\(_3\) (HFC-134a), from a ground-based Fourier Transform InfraRed (FTIR) spectrometer located at the Jungfraujoch station of the Network for the Detection of Atmospheric Composition Change (NDACC). Since the regulation of chlorofluorocarbons (CFCs) and hydrochlorofluorocarbons (HCFCs) by the Montreal Protocol and its subsequent amendments, HFCs became the primary substitute for these restricted species, leading to a drastic increase in their concentration in the atmosphere. However, HFCs are potent greenhouse gases, and in 2016 their usage became regulated by the Kigali Amendment to the Montreal Protocol.
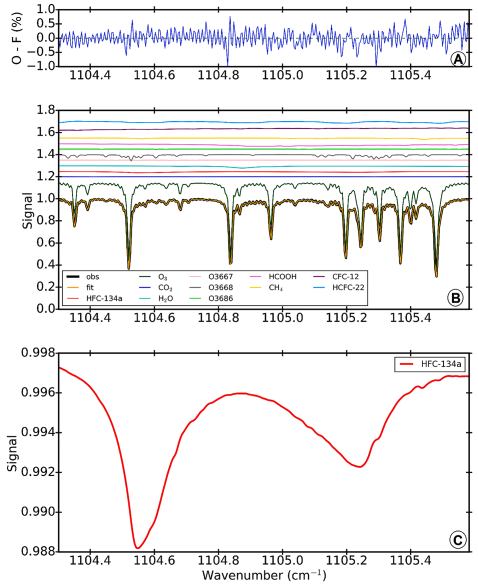
The retrieval strategy developed in this work employs Tikhonov regularization to retrieve total column HFC-134a from the solar absorption spectra by fitting the spectra over a single microwindow covering 1104.300–1105.585 cm \(^{-1}\). The inversion is performed using the SFIT4 algorithm, which applies the Optimal Estimation Method (OEM), and uses 41 layers spanning from the surface to 120 km. An example of the spectral window, with the interfering species and the HFC-134a absorption feature, is shown in Figure 1.

Figure 1: Spectral window for HFC-134a for a spectrum recorded on 25 May 2016. The top panel shows the residuals for the retrieval, the middle shows the simulated absorption by HFC-134a and the interfering species, and the bottom panel shows a magnified view of the HFC-134a absorption.
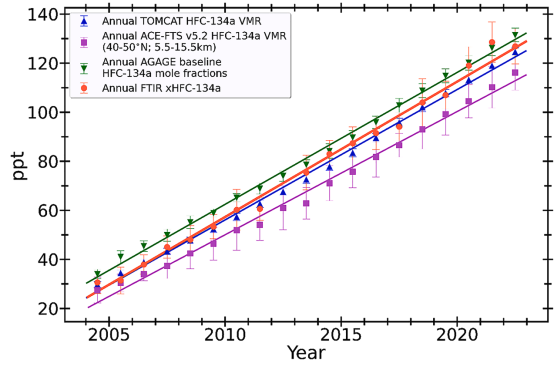
Having developed this new total column product, the results are compared against ACE-FTS measurements over Europe, the TOMCAT 3D chemical transport model, and the in-situ Advanced Global Atmospheric Gases Experiment (AGAGE) measurements for validation purposes. Data is assessed for the period January 2004 to December 2022. This validation compares the annual means of the four datasets, and specifically focuses on the trend in total column HFC-134a. These annual means are shown in Figure 2. Good agreement is found between the datasets, with calculated trends for the FTIR of 7.34+-0.16 % yr\(^{-1}\), for ACE-FTS of 7.29+-0.16 % yr\(^{-1}\), for TOMCAT of 7.12+-0.05 % yr\(^{-1}\), and for AGAGE of 6.61+-0.05 % yr\(^{-1}\). Overall, the agreement between these datasets validates the new retrieval scheme.

Figure 2: Annual mean total column HFC-134a from the four different datasets used in this study. Vertical errorbars denote the one sigma standard deviation, and the linear trends are shown as the straight lines.
