Among all inorganic chlorine compounds in the upper stratosphere, \(HCl\) is the most abundant therefore, observations of \(HCl\) molecules aids in obtaining long-term quantitative estimations of the total budget of the stratospheric chlorine compounds. In the paper by Nara et. al., vertical profiles of \(HCl\) measured by the Superconducting Submillimeter-Wave Limb-Emission Sounder (SMILES) from space at altitudes of 16 - 100 km and validation against data from several other space-based instruments are presented.
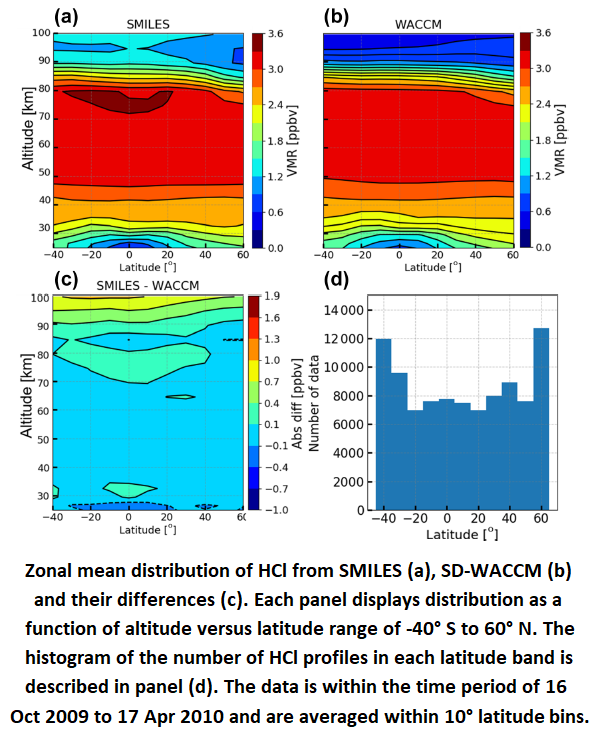
The SMILES instrument was launched in 2009. It conducts measurements of ozone and other species that contribute to the destruction of ozone such as \(HCl\). It's main mode of measurement is limb observations from the International Space Station (ISS). SMILES has three bands in the submillimeter wave region: band A (624.32–625.52 GHz), band B (625.12–626.32 GHz), and band C (649.12–650.32 GHz). The figure below shows the zonal mean distribution of \(HCl\) from SMILES and is compared to SD-WACCM (Specified Dynamics - Whole Atmosphere Community Climate Model) along with the histogram of the number of \(HCl\) profiles.

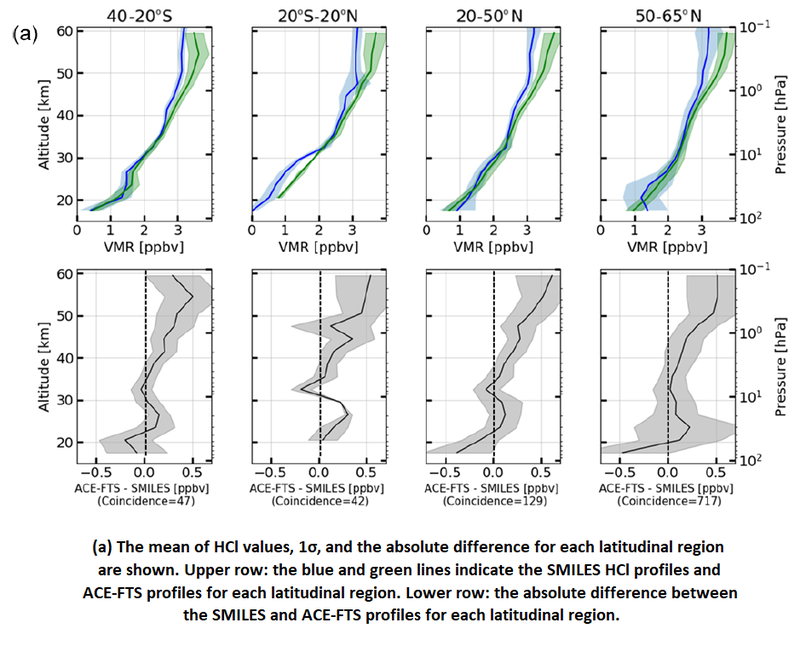
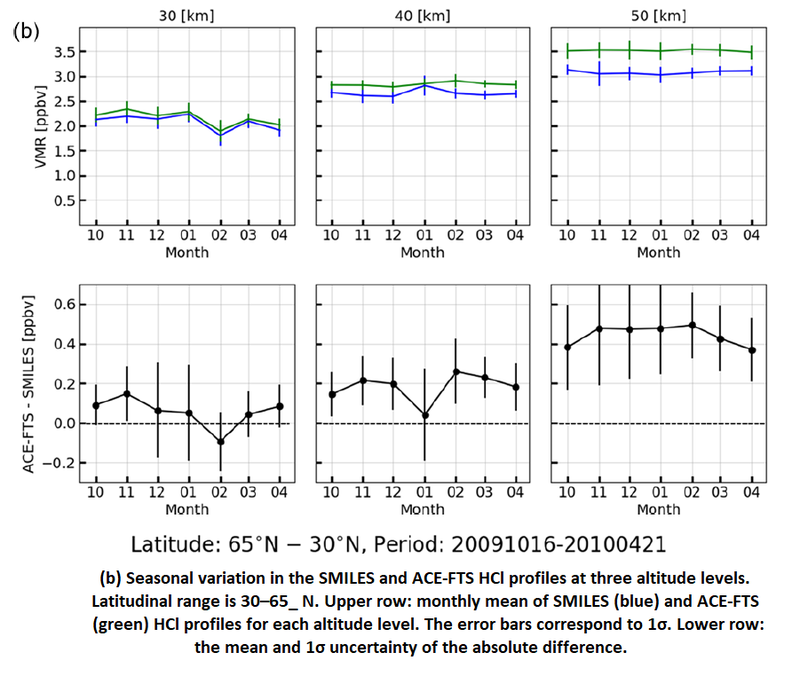
A comparison of \(HCl\) vertical profiles between SMILES and ACE-FTS have been made. The latitude range used is 40 degrees south to 60 degrees north. The number of coincident data pairs was 935. The SMILES \(HCl\) profiles agreed with those of the ACE-FTS by 0.2 ppbv between 20 and 40 km (50–2 hPa), while 0.5 ppbv (15 %) lower than those of ACE-FTS above 40 km. The figure below shows these comparisons for each latitudinal region. In the tropical region, a large discrepancy was observed at an altitude of 25 km because of relativity poor sampling number. The \(HCl\) profiles observed using the SMILES were about 0.5 ppbv (15 %) less than those of ACEFTS for each latitudinal region above 50 km. The difference for every month, shown in the lower panels, was represented by the mean for each month at each altitude, and the error bar showed the 1σ standard deviation. No significant seasonal dependence of the difference was observed. The difference of \(HCl\) value from these measurements was consequently about 0.5 ppbv at 50 km.


Reference
Nara, S., Sato, T. O., Yamada, T., Fujinawa, T., Kuribayashi, K., Manabe, T., Froidevaux, L., Livesey, N. J., Walker, K. A., Xu, J., Schreier, F., Orsolini, Y. J., Limpasuvan, V., Kuno, N., and Kasai, Y.: Validation of SMILES HCl profiles over a wide range from the stratosphere to the lower thermosphere, Atmos. Meas. Tech., 13, 6837–6852, https://doi.org/10.5194/amt-13-6837-2020, 2020.
