A comparison of water vapour profiles in the upper troposphere and lower stratosphere (UTLS) derived from Atmospheric Chemistry Experiment (ACE) satellite measurements and coincident ground-based measurements taken at a high Arctic observatory at Eureka, Nunavut, Canada are made in this study. The ground-based instruments include:
- Bruker 125HR solar absorption Fourier transform infrared spectrometer
- radiosondes launched from the Eureka Weather Station
The ACE instruments include:
- ACE Fourier Transform Spectrometer (ACE-FTS)
- ACE Measurement of Aerosol Extinction in the Stratosphere and Troposphere Retrieved by Occultation (ACE-MAESTRO)
In order to put the results of the ACE instruments in context, additional comparisons to other satellite instruments are included. These satellites are:
- Atmospheric Infrared Sounder (AIRS),
- Michelson Interferometer for Passive Atmospheric Sounding (MIPAS),
- Microwave Limb Sounder (MLS),
- Scanning Imaging Absorption Spectrometer for Atmospheric CHartography (SCIAMACHY),
- Tropospheric Emission Spectrometer (TES)
Results:
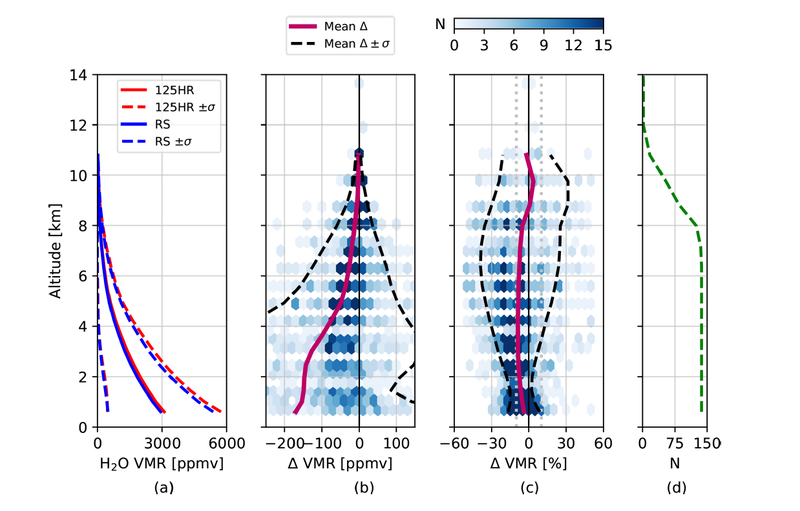
The comparison between Eureka radiosonde data and PEARL Bruker 125HR (125HR for short) water vapour Volume Mixing Ratios (VMRs) is shown below. Panel (a) shows the mean profiles in a solid line and the standard deviation in a dashed line. Panel (b) shows the mean VMR difference (radiosonde - 125HR). Panel (c) shows the mean VMR percentage difference where the dotted grey line refers to +/- 10%. The blue color shading refers to the number of difference pairs in each hexagon. Panel (d) shows the number of coincident profile pairs at each altitude level. Comparisons are shown up to an altitude of 11 km due to the number of coincident pairs being less than 15 and therefore not meeting the criteria for comparison. Between 8 and 14 km there is an agreement of within 5% between the radiosonde and 125HR . Below 8 km, 125HR shows a wet bias and agreement decreases to within 8% which increases below 2 km.

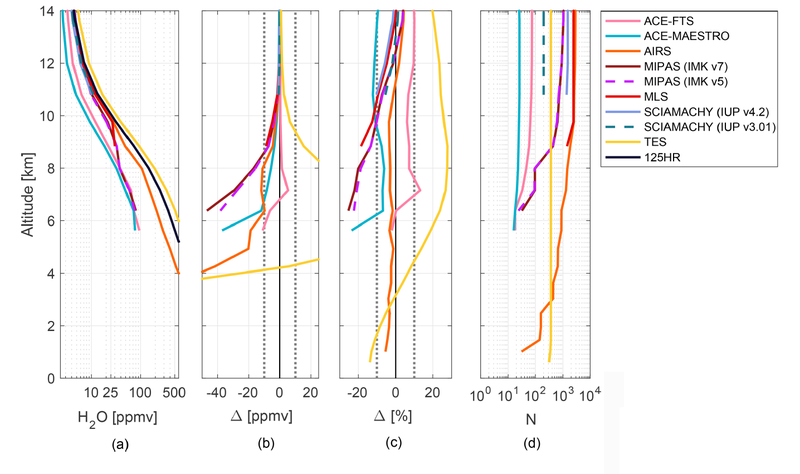
A summary of differences between satellite measurements and PEARL Bruker 125HR water vapour VMR is shown below. Panel (a) shows the mean profiles used in this comparison. Panel (b) shows the mean VMR differences (satellite profiles - the 125HR profiles). Panel (c) shows the mean percentage differences (satellite profiles - the 125HR profiles). Panel (d) shows the number of coincident profile pairs contributing to the comparison at each altitude level. The grey dotted lines show +/-10 ppmv for panel (b) and +/-10% for panel (c). The x-axis for panels (a) and (d) are on a log scale.

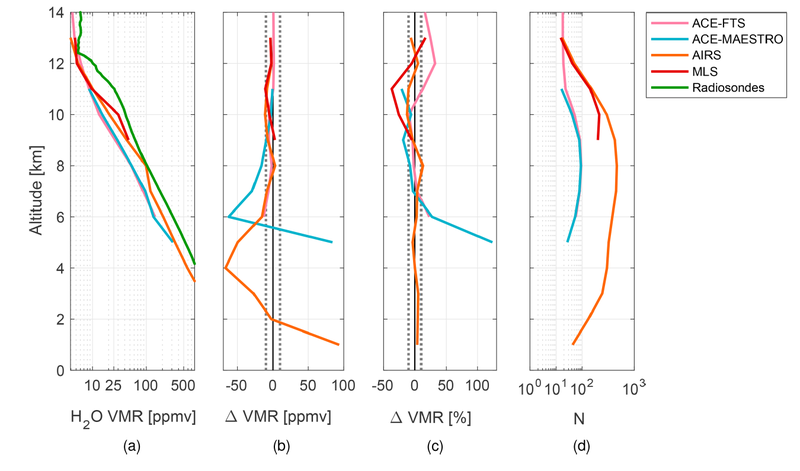
A summary of differences between satellite measurements and Eureka radiosonde measurements of water vapour VMR is shown below. Panel (a) shows the mean profiles used in this comparison. Panel (b) shows the mean VMR differences (satellite profiles - radiosonde profiles). Panel (c) shows the mean percentage differences (satellite profiles - radiosonde profiles). Panel (d) shows the number of coincident profile pairs contributing to the comparison at each altitude level. The grey dotted lines show +/-10 ppmv for panel (b) and +/-10% for panel (c). The x-axis for panels (a) and (d) are on a log scale.

The ACE-FTS comparisons show a positive (wet) bias of between 7% and 10% relative to the 125HR in the 8 to 14 km altitude range. Relative to the Eureka radiosondes, ACE-FTS shows very close agreement (within 4% or 6 ppmv) in the upper troposphere (7 to 9 km). At altitudes above 10 km, a positive (wet) bias relative to the radiosondes is observed, ranging between 12% and 32 %, although this corresponds to very small mean differences. These results indicate that ACE-FTS offers accurate H2O profiles in the Arctic UTLS region.
ACE-MAESTRO profiles show a dry bias relative to the 125HR of approximately 10% down to 7 km. Comparisons to the radiosondes also showed a dry bias, ranging from -3% at 7 km to -21% at 11 km. At 6 km and below, large differences between ACE-MAESTRO and the radiosonde profiles are observed, as was the case in the 125HR comparison; however, in both cases there are too few coincidences for firm conclusions.
For both ACE-FTS and ACE-MAESTRO, measurements at altitudes below approximately 5 km are often not possible because ACE’s sun tracker is unable to lock onto the Sun reliably due to cloud effects and refraction. This issue may contribute to the larger differences observed at low altitudes.
Reference
Weaver, D., Strong, K., Walker, K. A., Sioris, C., Schneider, M., McElroy, C. T., Vömel, H., Sommer, M., Weigel, K., Rozanov, A., Burrows, J. P., Read, W. G., Fishbein, E., and Stiller, G.: Comparison of ground-based and satellite measurements of water vapour vertical profiles over Ellesmere Island, Nunavut, Atmos. Meas. Tech., 12, 4039–4063, https://doi.org/10.5194/amt-12-4039-2019, 2019.
